"Evanjellyfish"
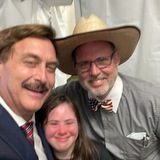
At the Ohio revival today, Coach Dave called our loser preachers "evanjellyfish."
Stealing that one.
After hearing my talk he added, "We are experiencing a rude awakening, and after that a great awakening."
I've been saying for almost two years that "our legislatures are full of spineless eunuchs."
Now that I've met with so many legislators, I can assure you that there isn't a single good legislature in the country. Not a single one represents the interests of their constituents.
Too many of our churches are apostate, and our citizens who are supposed to be virtuous and sovereign are depraved and apathetic.
🙏94👍39😢18🔥11👏7❤6
“Normal Behavior”
I read the gun laws before attending the revival today. It turns out that in Ohio the only time someone without a conceal carry license is not allowed to carry a loaded gun in the car is when driving in a school safety zone.
I think everyone should carry as much as possible to normalize the behavior. We’re all safer when more people are packing.
I imagine a young child in the grocery store saying, “Mommy he has a gun!” And then mama replying, “Yes honey, don’t you feel safer now? He’s caring that gun to protect all of us.”
https://www.notguiltyadams.com/blog/ohio-s-new-gun-laws-2022-what-you-need-to-know.cfm#:~:text=Ohio%20is%20now%20a%20%E2%80%9Cconstitutional,and%2For%20inside%20their%20vehicle
The Law Offices of Steven R. Adams
OHIO’S NEW GUN LAWS 2022: What You Need to Know
Ohio’s gun laws changed effective June 13, 2022.
👍120❤43🔥10🥰2
"Martin Luther"
A few years ago I was having a heated argument with the pastor at my church. I had been formally exposing the heresies being taught from the pulpit and showing graphs of the resulting declining membership and attendance to our church leadership.
When they wouldn't listen, I started posting on social media.
The pastor was very angry, and asked me why I was doing this. I explained that I was seeking reform in our church, and if the members were informed what was going on they would also demand reform.
After all, my denomination calls itself "reformed," and I was simply following the model of one of the key founders of the reformation movement.
And the modern version of the Wittenberg Door is social media.
The pastor exclaimed, "But you are not Martin Luther!" And stormed out of the room.
No, I am not.
But one of Luther's foundational precepts was that personal study of the Bible and an individual's Spirit-led conscience should be their guide on theological matters unless proven otherwise from Holy Scripture.
And sadly, as in Luther's day, my former church has lost its way and is apostate.
"Here I stand, I can do no other, so help me God. Amen."
👍100❤🔥41🙏26👏14🔥11😢4
"How are things going?"
(Graph is from the CDC.)
I periodically check this graph to see how dying is going in the US.
The graph shows the total weekly number of deaths in the US from all causes.
It's obvious in the graph that there were lots of extra deaths in 2020 and 2021 (COVID related), and that things are settling back to more normal rates in 2022.
Because the number of deaths in 2020-2021 were so elevated, my working hypothesis is that unless there is a new cause we should be seeing deaths drop below normal in the near future because a bunch of folks died earlier than they would have otherwise.
We shall see. Maybe there are new causes.
👍56😢10🔥3👎1
"Hurricanes"
I don't follow the media reports on such matters; it is deep in propaganda and shallow in facts.
I am certain that once the dust settles there will be all sorts of commentators blaming the recent hurricane on climate change.
It's religious dogma for them.
So, I thought I would share this graph of DATA to set the record straight, in preparation for their blatherings, and to equip you to respond.
Follow the DATA!
👍76🔥13❤8
“Global Warming?”
Above is an updated graph of the ENTIRE satellite record of global average atmospheric temperatures. I’ve been carefully tracking these measurements and discussion since the early 1980’s. (Scientists began these measurements in 1979 because of the myriad issues with land-based measurements. Credit: DrRoySpencer.com)
In short, the graph illustrates that the average temperature of the lower atmosphere is steadily increasing at a rate of about 1.3 C per 100 years, essentially unchanged for hundreds of years (since the ‘Little Ice Age.’)
Why is this result important? Because this is the precise portion of the atmosphere that was supposed to be dramatically affected by anthropogenic global warming. Clearly, no such effect is observed.
The scientific method requires experimentation; one makes a hypothesis as to the outcome, then does an experiment to test it. If the experiment comes out the way one predicts, then the hypothesis is confirmed and it is more likely that one knows what is going on. If a different outcome results, then the hypothesis is flawed, and the scientist needs to re-examine the fundamental assumptions and faulty understanding.
Since the temperature trend in the precise portion of the atmosphere that was supposed to be dramatically warming due to human-caused activity remains unchanged, the underlying assumptions of climate change alarmists are suspect, and need revision.
But it is difficult for scientists to revise their paradigms when their government funding relies upon propagation of their faulty explanations.
Science and politics do not play well together.
👍102🔥38❤15🤯1
"Sea Level Trends"
More data, to calibrate you with regards to the "Sea Level Rise Emergency."
The vast majority of the trends are labeled green and yellow, where green is less than one foot per 100 years, and yellow is less than two feet per 100 years. (Map graphic is from the NOAA website.)
For context, I also show the longer-term sea-level graph. Essentially, sea level has been steadily creeping up for thousands of years since the "big melt" following the last ice age. (Graph is from antarcticglaciers.org.)
Real data are the best antidote to alarmism.
👍45🔥9