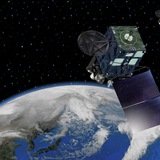
FrontpageDr. Tamlin Pavelsky, NASA’s Surface Water and Ocean Topography (SWOT) Hydrology Science Lead, gives an overview of SWOT hydrology data products.Link: https://podaac.jpl.nasa.gov/animations/Hydrology-Data-Products-from-the-SWOT-Mis…Media
via PO.DAAC https://podaac.jpl.nasa.gov/node/1980
via PO.DAAC https://podaac.jpl.nasa.gov/node/1980
Physical Oceanography Distributed Active Archive Center (PO.DAAC)
Hydrology Data Products from the SWOT Mission | PO.DAAC / JPL / NASA
Dr. Tamlin Pavelsky, NASA’s Surface Water and Ocean Topography (SWOT) Hydrology Science Lead, gives an overview of SWOT hydrology data products. Specifically, the Pixel Cloud (L2_HR_PIXC) netCDF, River (L2_HR_RiverSP) and Lake (L2_HR_LakeSP) Single Pass Vector…
Thursday, September 5, 2024The PO.DAAC is pleased to announce the public release of the Cyclone Global Navigation Satellite System (CYGNSS) data products from the CYGNSS science team including level 3 merged (MRG) V3.2.1 dataset, level 3 MRG Near Real Time (NRT) V3.2.1 dataset, and daily watermask v3.2 dataset from UC Berkeley. The datasets are provided in netCDF-4 format and extend from 1 August 2018 to the present, and additional denoscriptions of the data products are documented below:1. CYGNSS Level 3 MRG Science Data Record Version 3.2.1This dataset combines the L2 Fully Developed Seas (FDS) and Young Seas Limited Fetch (YSLF) winds and eliminates the need to choose between them depending on sea state development and the proximity to storms. The data are provided in netCDF-4 format and extend from 1 August 2018 to the present with an approximate 6 day latency. A tapered weighted averaging scheme is used centered on the 25 m/s wind radius of the storm. The 34 knot wind radius (R34) algorithm has been updated for v3.2.1 release to center around the National Hurricane Center (NHC) or the Joint Typhoon Warning Center (JTWC) instead of the CYGNSS Vmax location. The algorithm produces global (+/- 40 deg latitude) wind speeds reported on a 0.1x0.1 deg grid every 6 hours for each tropical cyclone, although some 6-hourly increments may be missing if there are an insufficient number of satellite overpasses of the storm during that time interval.2. CYGNSS Level 3 MRG Science Data Record Near Real Time Version 3.2.1This dataset combines the L2 FDS and YSLF winds and eliminates the need to choose between them depending on sea state development and the proximity to storms. The data are provided in netCDF-4 format and starts from the June 1, 2024 through the present with an approximate latency between 2 and 24 hours. A tapered weighted averaging scheme is used centered on the 25 m/s wind radius of the storm. The 34 knot wind radius (R34) algorithm has been updated for v3.2.1 release to center around the NHC/JTWC reported storm center instead of the CYGNSS Vmax location The algorithm produces global (+/- 40 deg latitude) wind speeds reported on a 0.1x0.1 deg grid every 6 hours for each tropical cyclone, although some 6-hourly increments may be missing if there are an insufficient number of satellite overpasses of the storm during that time interval. The netCDF files are output on a storm-by-storm basis.3. UC Berkeley CYGNSS Level 3 Daily RWAWC Watermask Version 3.2This dataset was developed by CYGNSS investigators in the Department of Civil and Environmental Engineering at the University of California, Berkeley. It is derived from version 3.2 of the CYGNSS L1 SDR dataset, and provides daily binary inland surface water classification data at a 0.01-degree (~1x1 kilometer) resolution with an approximate 6-day latency. This product, known as the UC Berkeley Random Walk Algorithm WaterMask from CYGNSS (Berkeley-RWAWC), generates water classification for a given location based on CYGNSS observations combined with a random walker algorithm. The watermask variable includes binary values indicating land (0), surface water (1), and no data/ocean (-99).The CYGNSS datasets and documents are accessible via the dataset landing page on PO.DAAC web portal. Users are recommended to download the data using the podaac-data-subscriber. We also encourage users to visit PO.DAAC Cloud Cookbook for detailed information about how to access the data from NASA Earthdata Cloud. General information regarding the CYGNSS mission is available from the mission website.Summary of Temporal and Spatial Resolution
Temporal Resolution
Spatial Resolution
Latency
L3 MRG V3.2.1
Daily
0.1x0.1 degree
6 hrs
L3 MRG NRT V3.2.1
Daily
0.1x0.1 degree
2 to 24 hrs
L3 Daily Watermask V3.2
Daily
0.01x0.01 degree
6 days
DOI:
CYGNSS_L3_MRG_V3.2.1 (10.5067/CYGNS-3M321)
CYGNSS_L3_MRG_NRT_V3.2.1 (10.5067/CYGNS-3N321)
CYGNSS_L3_UC_BERKELEY_WATERMASK_DAILY_V3.2 (10.5067/CYGNS…
Physical Oceanography Distributed Active Archive Center (PO.DAAC)
CYGNSS Level 1 Science Data Record Version 3.2| Physical Oceanography Distributed Active Archive Center (PO.DAAC)
This CYGNSS Level 1 (L1) science data record dataset contains the version 3.2 geo-located Delay Doppler Maps (DDMs) calibrated into Power Received (Watts) and Bistatic Radar Cross Section (BRCS) expressed in units of m2 from the Delay Doppler Mapping Instrument…
FrontpageUC Berkeley CYGNSS Level 3 Daily RWAWC Watermask Version 3.2Link: https://podaac.jpl.nasa.gov/animations/CYGNSS-L3-UC-BERKELEY-WATERMASK-DAILY-V3.…This graphic illustrates information gathered from the UC Berkeley CYGNSS Level 3 Daily RWAWC Watermask Version 3.2 dataset
via PO.DAAC https://podaac.jpl.nasa.gov/node/1983
via PO.DAAC https://podaac.jpl.nasa.gov/node/1983
Physical Oceanography Distributed Active Archive Center (PO.DAAC)
Animation: UC Berkeley CYGNSS Level 3 Daily RWAWC Watermask Version 3.2 | PO.DAAC / JPL / NASA
Animation of the daily watermask over the period of 1 January 2021 to 10 August 2024, produced using the CYGNSS level 3 daily watermask version 3.2 dataset which was developed by CYGNSS investigators in the Department of Civil and Environmental Engineering…
FrontpageFollow Dr. Cassie Nickles for a workshop on the Surface Water and Ocean Topography (SWOT) satellite presented at the Hacking Limnology AEMON-J Virtual Summit!Link: https://podaac.jpl.nasa.gov/animations/SWOT-Data-Access-Workshop-July-2024Media
via PO.DAAC https://podaac.jpl.nasa.gov/node/1985
via PO.DAAC https://podaac.jpl.nasa.gov/node/1985
Physical Oceanography Distributed Active Archive Center (PO.DAAC)
SWOT Data Access Workshop July 2024 | PO.DAAC / JPL / NASA
Follow along with Dr. Cassie Nickles for a workshop on the Surface Water and Ocean Topography (SWOT) satellite presented at the Hacking Limnology AEMON-J July 2024 Virtual Summit! In this workshop, participants are introduced to SWOT and the various ways…
Lightning with Bebinca in the western Pacific https://cimss.ssec.wisc.edu/satellite-blog/archives/60816
#Typhoon #Pulasan
https://www.ssd.noaa.gov/PS/TROP/floaters/15W/imagery/vis_lalo-animated.gifNote: NOAA is keeping this gif animation up to date but the gif preview provided by Telegram does not evolve with time, thus click the url to watch the auto-updated gif please.
https://www.ssd.noaa.gov/PS/TROP/floaters/15W/imagery/vis_lalo-animated.gifNote: NOAA is keeping this gif animation up to date but the gif preview provided by Telegram does not evolve with time, thus click the url to watch the auto-updated gif please.
Monday, September 23, 2024The PO.DAAC is pleased to announce the completion of the back-fill processing for the version 6.0 SMAP Sea Surface Salinity (SSS) validated datasets from Remote Sensing Systems (RSS), sponsored by the NASA Ocean Salinity Science Team. The datasets now span from May 25, 2015, to the present.DOI: SMAP_RSS_L2_SSS_NRT_V6 (10.5067/SMP60-2SNRT) SMAP_RSS_L2_SSS_V6 (10.5067/SMP60-2SOCS) SMAP_RSS_L3_SSS_SMI_8DAY-RUNNINGMEAN_V6 (10.5067/SMP60-3SPCS) SMAP_RSS_L3_SSS_SMI_MONTHLY_V6 (10.5067/SMP60-3SMCS)Release Announcement:https://podaac.jpl.nasa.gov/announcements/2024-03-26-SMAP-RSS-Sea-Surface-Salinity-V6.0-Validated-Dataset-ReleasePO.DAAC Animation for 8-Day Running Mean V6.0:https://podaac.jpl.nasa.gov/animations/Sea-Surface-Salinity-8-Day-Running-Mean-from-SMAP-RSS-V6.0-2015-2024Comments/Questions? Please contact podaac@podaac.jpl.nasa.gov or visit the PO.DAAC on Earthdata Forum.
via PO.DAAC https://podaac.jpl.nasa.gov/announcements/2024-09-23-Back-fill-completion-of-SMAP-RSS-Sea-Surface-Salinity-V6.0-Validated-Datasets
via PO.DAAC https://podaac.jpl.nasa.gov/announcements/2024-09-23-Back-fill-completion-of-SMAP-RSS-Sea-Surface-Salinity-V6.0-Validated-Datasets
Physical Oceanography Distributed Active Archive Center (PO.DAAC)
RSS SMAP Level 2C Sea Surface Salinity NRT V6.0 Validated Dataset| Physical Oceanography Distributed Active Archive Center (PO.DAAC)
The SMAP-SSS level 2C near real-time (NRT) V6.0 dataset produced by the Remote Sensing Systems (RSS) and sponsored by the NASA Ocean Salinity Science Team, is a validated product that provides near real-time orbital/swath data on sea surface salinity (SSS)…
FrontpageSea Surface Salinity 8-Day Running Mean from SMAP RSS V6.0 (2015-2024)Link: https://podaac.jpl.nasa.gov/animations/Sea-Surface-Salinity-8-Day-Running-Mean-f…This graphic illustrates information gathered from Sea Surface Salinity 8-Day Running Mean from SMAP RSS V6.0 (2015-2024)
via PO.DAAC https://podaac.jpl.nasa.gov/node/1989
via PO.DAAC https://podaac.jpl.nasa.gov/node/1989
Physical Oceanography Distributed Active Archive Center (PO.DAAC)
Animation: Sea Surface Salinity 8-Day Running Mean from SMAP RSS V6.0 (2015-2024) | PO.DAAC / JPL / NASA
Animation of sea surface salinity from 1 April 2015 to 27 August 2024 based on the 8-day running mean version 6.0 Level 3 NASA Soil Moisture Active Passive (SMAP) dataset from Remote Sensing Systems (RSS). The dataset can be accessed from the PO.DAAC Portal…
👍1
CSPP Geo Software to create LightningCast imagery released https://cimss.ssec.wisc.edu/satellite-blog/archives/60965
Media
Figure Caption: September 23, 2024 satellite (a) sea surface temperature, (b) sea surface temperature anomalies compared to the 2003-2014 mean, and (c) sea level observations showing the particularly high surface temperatures and subsurface ocean heat in the Gulf of Mexico before the passage of hurricane Helene. (d) Differences in satellite sea surface temperature after (September 27, 2024) and before (September 23, 2024) Hurricane Helene, showing the ‘cold wake’ after the hurricane passage. Hurricane Helene’s advisory track4 is overlaid on the maps (the size of the symbols represents the category of the storm along its trajectory).
Hurricane Helene made landfall in the Big Bend area of the Florida Gulf Coast as a category 4 storm late in the evening of September 26, 20241. Although slowly weakening as it moved north, Helene caused significant damages and casualties across a large portion of the Southeast U.S., including North Carolina, South Carolina, Georgia, Florida, Tennessee and Virginia and will most likely rank as one of the deadliest storms to hit the U.S. in recent times2.The Atlantic hurricane season spans from June 1 to November 30 every year. Tropical Storm Helene formed in the Caribbean Sea on Monday September 23, 2024 and then developed into a category 1 hurricane on September 25, 2024. Helene then rapidly transformed from a category 1 hurricane to a category 4 hurricane in less than a day on September 26, 2024, less than a day before landfall1. This rapid intensification is in part due to very high ocean temperatures across the Gulf of Mexico that act as ‘fuel’ for hurricanes3. The storm moved over the Loop Current, a strong flow of warm water that travels from the Caribbean, loops in the eastern Gulf of Mexico like a horseshoe before moving through the Florida Strait up the Atlantic Ocean. Because the Loop Current transports warm waters from the Tropics, storms moving over it often get enough energy from it to rapidly intensify.
via PO.DAAC https://podaac.jpl.nasa.gov/DataAction-2024-10-03-The-warm-waters-in-the-Gulf-of-Mexico-helped-fuel-Hurricane-Helene
Monday, October 7, 2024Animation of daily wind speed measurements from the Compact Ocean Wind Vector Radiometer (COWVR) instrument during its first year of operation. COWVR was developed at the Jet Propulsion Laboratory and is installed on the International Space Station, where it has been collecting measurements since January 2022. COWVR aims to demonstrate new low-cost microwave sensor technologies for weather applications. This animation uses the first public release of the data which includes wind speed, wind direction, and moisture parameters and can be found on NASA’s Physical Oceanography Distributed Active Archive Center (PO.DAAC) at https://doi.org/10.5067/COWVR-STPH8-EDR100. In the future these data may be retired and replaced with updated versions in which case please see https://podaac.jpl.nasa.gov/COWVR-TEMPEST for a list of all data sets including the most recent public versions, as well as information on the COWVR-TEMPEST project.
via PO.DAAC https://podaac.jpl.nasa.gov/animations/COWVR-Level-2-Wind-Speed-First-Year-of-Operation
via PO.DAAC https://podaac.jpl.nasa.gov/animations/COWVR-Level-2-Wind-Speed-First-Year-of-Operation
Physical Oceanography Distributed Active Archive Center (PO.DAAC)
COWVR STP-H8 Surface Wind Vector and Column-Integrated Atmospheric Water Measurements Version 10.0| Physical Oceanography Distributed…
!!!Temporary notice posted Sept. 27th, 2024!!! These data are in the process of being ingested and not all files are available yet. The data were made public early to allow assessment by early science users. Accordingly, not all data set resources may be…
Wednesday, October 9, 2024The PO.DAAC is pleased to announce the first public release of the COWVR-TEMPEST Temperature Sensor Data Records (TSDRs) and Environmental Data Record (EDR), produced by the Jet Propulsion Laboratory. The COWVR (Compact Ocean Wind Vector Radiometer) and TEMPEST (Temporal Experiment for Storms and Tropical Systems) instruments are passive microwave radiometers installed on the International Space Station as part of the Space Test Program - Houston 8 (STP-H8) technology demonstration mission. The project aims to demonstrate a lower-cost, lighter-weight sensor architecture for providing microwave data, with the primary objective of ocean surface vector wind products and tropical cyclone intensity tracking for the Department of Defense. More information regarding the project can be found at PO.DAAC’s project page.An animation of daily global wind speed from COWVR during its first year of operation can be found here .The data sets include Level 1 brightness temperatures (TSDRs) from both instruments, and Level 2 wind vector, column liquid water, and column precipitable water vapor from COWVR (EDR). Data records span January 2022 to the present, with forward streaming planned at least until August of 2025. Both Level 1 and Level 2 data provide data over the satellite tracks/swaths in HDF5 format, with roughly one file per hour (the orbital period of the International Space Station is ~90 minutes). Version 10.0 is the first un-restricted public release, and is named as such to be consistent with the internal version numbering of the project team prior to release. More information can be found in the EDR User Guide and the Data Product Development Documents, linked to on the landing pages.The data sets are described and discoverable via the PO.DAAC data portal.DOI:
COWVR_STPH8_L2_EDR_V10.0 (10.5067/COWVR-STPH8-EDR100)
COWVR_STPH8_L1_TSDR_V10.0 (10.5067/COWVR-STPH8-TSDR100)
TEMPEST_STPH8_L1_TSDR_V10.0 (10.5067/TEMPEST-STPH8-TSDR100)Due to the format of these data files, services such as OPeNDAP and Level 2 Subsetter are not available. However, data can be accessed/downloaded via the virtual directory, Earthdata Search, the podaac-data-subscriber tool, or using s3 endpoints in an AWS cloud environment. Data files for period covering January 2022 - present are actively being reprocessed by the COWVR-TEMPEST Project Team, and are ingested by PO.DAAC as they become available. Therefore not all files are available as of this release announcement, but will be over the next few weeks. Related PO.DAAC Animation:COWVR Level 2 Wind Speed - First Year of Operation (https://podaac.jpl.nasa.gov/animations/COWVR-Level-2-Wind-Speed-First-Year-of-Operation) Citations:Brown, Shannon, Paolo Focardi, Amarit Kitiyakara, Frank Maiwald, Lance Milligan, Oliver Montes, Sharmila Padmanabhan et al. "The COWVR Mission: Demonstrating the capability of a new generation of small satellite weather sensors." In 2017 IEEE Aerospace Conference, pp. 1-7. IEEE, 2017.Brown, Shannon, Paolo Focardi, Amarit Kitiyakara, Frank Maiwald, Oliver Montes, Sharmila Padmanabhan, Richard Redick, D. Russel, and James Wincentsen. "The compact ocean wind vector radiometer: A new class of low-cost conically scanning satellite microwave radiometer system." In Proc. IEEE Geosci. Remote Sens. Soc.(IGRSS), 35th Can. Remote Sens. Soc.(CSRS), pp. 1-3. 2014.Farrar, Spencer, Steven Swadley, Shannon Brown, Eric Simon, Sayak Biswas, David Kunkee, and Kieran Smith. "An Initial on-Orbit Performance Assessment of the Compact Ocean Wind Vector Radiometer (COWVR)." In IGARSS 2024-2024 IEEE International Geoscience and Remote Sensing Symposium, pp. 6277-6281. IEEE, 2024.
via PO.DAAC https://podaac.jpl.nasa.gov/announcements/2024-10-09-First-Public-Release-V10.0-Microwave-Brightness-Temperatures-Ocean-Wind-Vectors-and-Atmospheric-Water-Products-from-COWVR-TEMPEST-STP-H8-Project
YouTube
COWVR Level 2 Wind Speed - First Year of Operation
Animation of daily wind speed measurements from the Compact Ocean Wind Vector Radiometer (COWVR) instrument during its first year of operation. COWVR was developed at the Jet Propulsion Laboratory and is installed on the International Space Station, where…
FrontpageCOWVR Level 2 Wind Speed - First Year of OperationLink: https://podaac.jpl.nasa.gov/animations/COWVR-Level-2-Wind-Speed-First-Year-of-Op…This graphic illustrates the daily wind speed measurements from the Compact Ocean Wind Vector Radiometer (COWVR) instrument during its first year of operation.
via PO.DAAC https://podaac.jpl.nasa.gov/node/1994
via PO.DAAC https://podaac.jpl.nasa.gov/node/1994
Physical Oceanography Distributed Active Archive Center (PO.DAAC)
Animation: COWVR Level 2 Wind Speed - First Year of Operation | PO.DAAC / JPL / NASA
Animation of daily wind speed measurements from the Compact Ocean Wind Vector Radiometer (COWVR) instrument during its first year of operation. COWVR was developed at the Jet Propulsion Laboratory and is installed on the International Space Station, where…
Parade of tropical cyclones across the western Pacific
via Himawari-9 – CIMSS Satellite Blog (author: Scott Lindstrom)
via Himawari-9 – CIMSS Satellite Blog (author: Scott Lindstrom)
Telegraph
Parade of tropical cyclones across the western Pacific
Total Precipitable Water fields over the western Pacific on 10/11 November 2024, above, show 4 tropical cyclones at different stages of development across the West Pacific. The screenshot from the Joint Typhoon Warning Center, below, shows the 4 storms: Yinxing…
Man-Yi moves through the Marianas Islands
via Himawari-9 – CIMSS Satellite Blog (author: Scott Lindstrom)
via Himawari-9 – CIMSS Satellite Blog (author: Scott Lindstrom)
Telegraph
Man-Yi moves through the Marianas Islands
Day Night Band imagery from the three JPSS Satellites — NOAA-21 (1515 UTC), Suomi NPP (1537 UTC) and NOAA-20 (1602 UTC) show Tropical Storm Man-Yi as it approached the southern Marianas Islands early in the morning on 13 November 2024 (Guam Time). These images…
#Typhoon #Man-yi
https://www.ssd.noaa.gov/PS/TROP/floaters/25W/imagery/vis_lalo-animated.gif Note: NOAA is keeping this gif animation up to date but the gif preview provided by Telegram does not evolve with time, thus click the url to watch the auto-updated gif please.
https://www.ssd.noaa.gov/PS/TROP/floaters/25W/imagery/vis_lalo-animated.gif Note: NOAA is keeping this gif animation up to date but the gif preview provided by Telegram does not evolve with time, thus click the url to watch the auto-updated gif please.
#Typhoon #Toraji
https://www.ssd.noaa.gov/PS/TROP/floaters/26W/imagery/vis_lalo-animated.gif Note: NOAA is keeping this gif animation up to date but the gif preview provided by Telegram does not evolve with time, thus click the url to watch the auto-updated gif please.
https://www.ssd.noaa.gov/PS/TROP/floaters/26W/imagery/vis_lalo-animated.gif Note: NOAA is keeping this gif animation up to date but the gif preview provided by Telegram does not evolve with time, thus click the url to watch the auto-updated gif please.
#Typhoon #Usagi
https://www.ssd.noaa.gov/PS/TROP/floaters/27W/imagery/vis_lalo-animated.gif Note: NOAA is keeping this gif animation up to date but the gif preview provided by Telegram does not evolve with time, thus click the url to watch the auto-updated gif please.
https://www.ssd.noaa.gov/PS/TROP/floaters/27W/imagery/vis_lalo-animated.gif Note: NOAA is keeping this gif animation up to date but the gif preview provided by Telegram does not evolve with time, thus click the url to watch the auto-updated gif please.